
Turnover cost is the aggregate financial burden across five distinct operational cost centers — recruiting, onboarding labor, productivity ramp, quality defect rates during ramp, and manager time diversion — that most accounting systems record as separate, unrelated line items. This structural fragmentation makes the true per-event cost invisible to the executives responsible for controlling it. A COO who sees only a recruiting invoice has seen, at best, an estimated 20–30% of the actual cost of a single departure.
Standard operational accounting is built around cash transactions. Recruiting fees generate invoices. Job board subscriptions appear on a credit card statement. These are visible.
What does not generate an invoice: the weeks a replacement bookkeeper operates at roughly half output. The portion of an operations manager’s working week consumed by exit interviews, knowledge transfer sessions, and error correction on a new hire’s first client deliverables. The client escalations triggered by a payroll specialist who left before documenting firm-specific configuration exceptions.
None of those appear on a P&L line. All of them are real costs.
The problem compounds in small and mid-market professional services firms — typically those in the $2M–$30M revenue band — because there is no dedicated HR operations function to absorb the administrative burden. The work falls directly on revenue-generating partners or the COO. Every hour a senior partner spends re-training an offshore bookkeeper is an hour not spent on billable advisory work. That opportunity cost is real, calculable, and almost universally uncalculated.
The Five Cost Centers
Cost Center 1: Recruiting Fees and Direct Replacement Costs
This is the only cost center most firms actually measure. It includes job board fees, agency placement fees (if applicable), and internal HR time spent on sourcing and screening. For offshore roles, direct recruiting costs are often lower in absolute dollar terms than equivalent US-based hires — but they are not zero, and they reset with every departure.
For a mid-level offshore accounting role, direct recruiting costs may run materially below what a domestic replacement would cost. However, offshore roles often require firm-specific workflow training that is not transferable from prior employers. A candidate who arrives with five years of bookkeeping experience still needs to learn your chart of accounts structure, your client communication protocols, your exception-handling procedures. That training investment is sunk the moment the employee leaves — and must be rebuilt from zero with each replacement.
Cost Center 2: Onboarding Labor
Onboarding labor is the internal staff time consumed in getting a replacement hire to operational baseline. This includes structured training sessions, system access provisioning, shadowing periods, and the informal knowledge transfer that happens in the first two to four weeks.
In offshore accounting and finance roles, this cost is disproportionately high relative to base salary because the knowledge being transferred is firm-specific and often undocumented. A mid-market CPA firm we advised had no formal time-to-full-productivity tracking for offshore roles. After implementing a 30-60-90 day milestone framework, they identified that their average ramp window was 11 weeks — and that error rates during weeks one through six were generating approximately six to eight hours of senior staff rework per new hire. That rework cost had never appeared in any budget line.
Cost Center 3: Productivity Ramp — The Largest Cost Nobody Tracks
A replacement hire typically operates at an estimated 25–50% of full productivity during the first 60–90 days. This is an illustrative operational range — but the directional reality is consistent across process-intensive roles.
The productivity ramp cost is frequently the largest single component of total turnover cost. It is also the most invisible, because it manifests as output deficit rather than cash outflow. The work either does not get done, gets done more slowly, or gets done incorrectly — none of which generates a line item on a financial statement.
Time-to-full-productivity — defined as the elapsed time from hire date to the point where a replacement employee achieves output quality and volume parity with the departed employee — is the single most operationally useful turnover cost metric that most COOs do not currently track.
Cost Center 4: Quality Defect Rates During Ramp
In process-intensive roles — bookkeeping, tax preparation, payroll processing, accounts payable — error rates for employees in their first 90 days are materially higher than for tenured staff. This is not a performance indictment of new hires. It is a structural reality of any role where accuracy depends on institutional knowledge that takes time to acquire.
The downstream costs of elevated defect rates include:
- Rework time from senior staff who must review, correct, and re-submit work product
- Client escalations when errors reach the client before internal review catches them
- Reputational risk in client-facing roles where relationship continuity has a direct revenue-retention dimension
Cost Center 5: Manager Time Diversion
Supervisors and team leads typically spend an estimated 15–25% of their working hours on activities directly caused by a departing or newly onboarded employee during an active transition period. This is an illustrative range based on general operational observation.
Those activities include exit interviews, knowledge transfer facilitation, re-training, error correction, and the informal mentoring that new hires require before they can operate independently. In a firm where the operations manager is also responsible for client delivery oversight, this diversion is not just an HR cost — it is a service quality risk.
The math is straightforward. An operations manager earning $90,000 annually who spends 20% of their time on turnover-related activities during a transition period is generating an implicit cost of $18,000 per year in diverted management capacity — before accounting for the downstream quality impact of reduced supervisory attention on the rest of the team.
Knowledge Concentration Risk: The Structural Amplifier
Knowledge concentration — where institutional knowledge about client preferences, workflow exceptions, and system configurations resides in a single employee — is a structural amplifier of turnover cost that is rarely quantified before a departure occurs.
A composite of three professional services firms in the $5M–$20M revenue band showed that knowledge concentration in a single offshore payroll specialist — who held undocumented client-specific configurations in working memory — created a three-week service disruption upon departure. The downstream client escalation costs dwarfed the direct recruiting replacement cost.
The mitigation is documentation discipline: standard operating procedures, exception logs, and configuration records that are maintained as living documents rather than residing in individual employees’ working memory.
Anonymized composite case studies based on operational engagements; specific firm details are not disclosed.

How It Works
The turnover cost accumulates across five sequential and overlapping phases from the moment an employee signals departure through the point a replacement reaches full productivity. The diagram below maps that flow.
Five-Phase Turnover Cost Accumulation
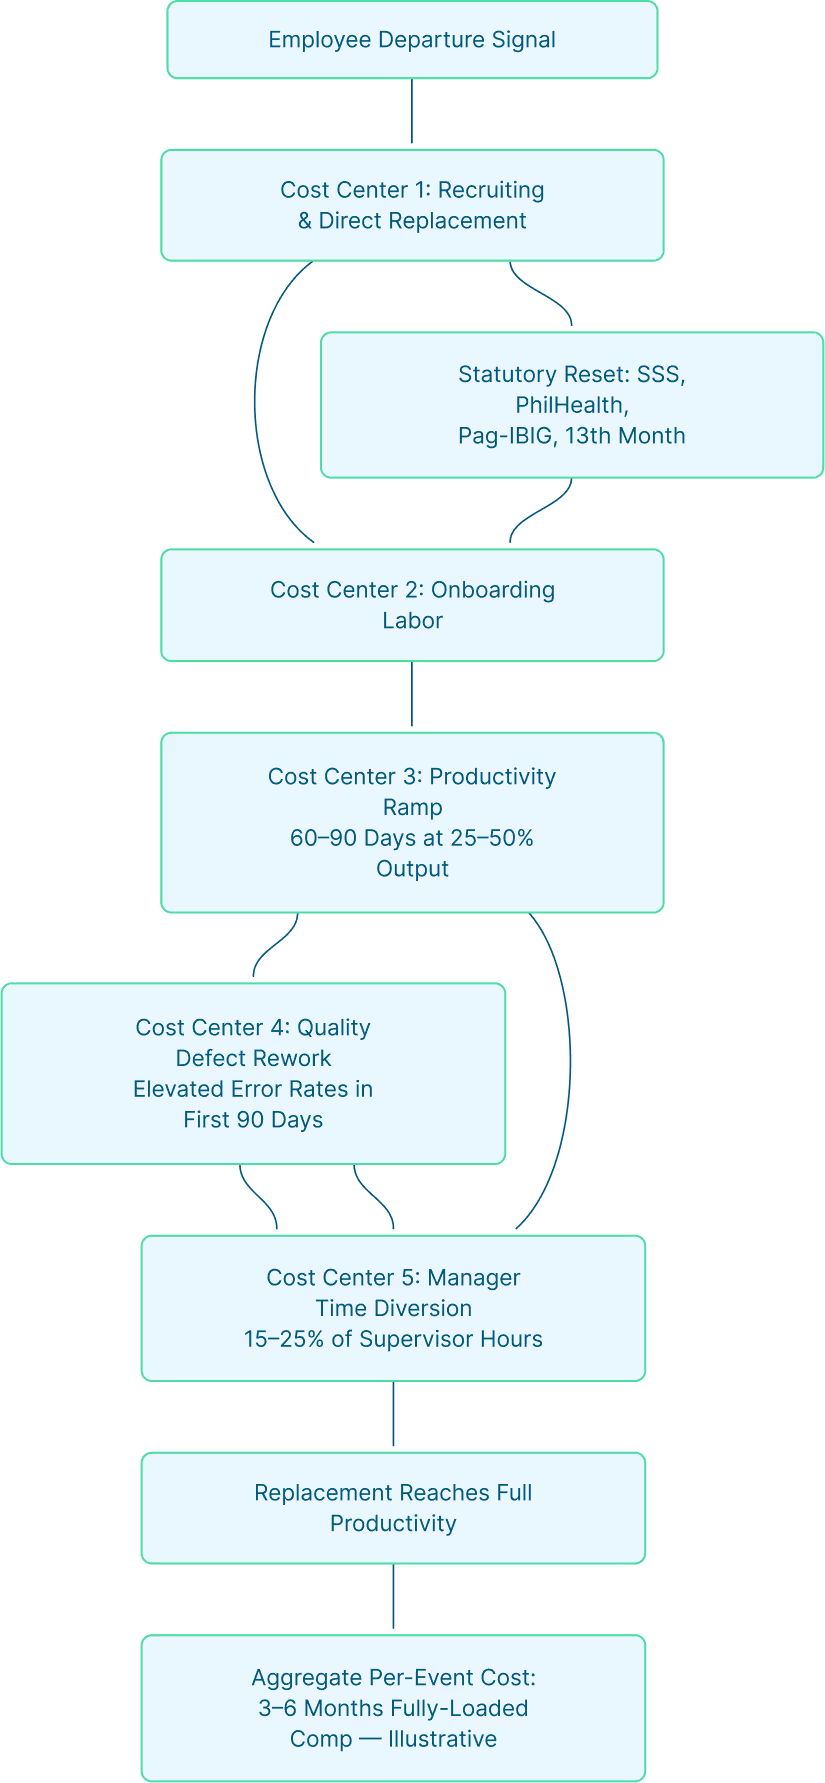
Phase 1 — Departure and Recruiting
The cost clock starts at departure. Direct recruiting costs — job board fees, agency fees if applicable, internal HR screening time — are incurred immediately. For offshore roles, absolute dollar costs are typically lower than domestic equivalents, but the firm-specific training investment accumulated in the departing employee is fully sunk.
Phase 2 — Onboarding Labor
Once a replacement is hired, internal staff time is consumed in structured training, system access provisioning, shadowing, and informal knowledge transfer. In offshore accounting roles, this phase is disproportionately expensive relative to base salary because the knowledge being transferred is firm-specific and often undocumented.
Phase 3 — Productivity Ramp
The replacement operates at an estimated 25–50% of full output for the first 60–90 days. This output deficit does not generate a financial statement line item — it manifests as slower throughput, deferred deliverables, or work that must be redone. Firms that implement structured 30-60-90 day onboarding frameworks with milestone-based competency checkpoints tend to observe shorter ramp windows, based on general operational experience with such programs.
Phase 4 — Quality Defect Rework
Elevated error rates during the ramp window generate rework time from senior staff, client escalations when errors reach the client before internal review, and reputational risk in client-facing roles. A composite back-office operations team at a regional accounting firm found that manager time diversion during a period of elevated offshore turnover was consuming approximately 18% of their operations manager’s working hours — effectively reducing supervisory capacity by nearly one full working day per week.
Phase 5 — Manager Time Diversion
Throughout phases 2–4, supervisors absorb an estimated 15–25% of their working hours on transition-related activities. In firms where the operations manager also carries client delivery responsibility, this diversion is simultaneously an HR cost and a service quality risk.
Seasonal Attrition: The Predictable Disruption
Turnover in offshore accounting and finance roles follows a documented seasonal pattern in the Philippine labor market. Q1 — the post-bonus season, typically January through March — and Q4 — the pre-holiday period — are historically higher-attrition windows. Employees who have received their 13th month pay and any performance bonuses are structurally more mobile in these periods.
An anonymized US tax and advisory firm with 12 offshore staff modeled this seasonal risk and pre-positioned a 60-day pipeline of pre-screened candidates. This reduced their average time-to-replacement from nine weeks to approximately 3.5 weeks, cutting the productivity-ramp cost component by an estimated 40–45% on a per-event basis.
Anonymized composite case studies based on operational engagements; specific firm details are not disclosed.

Key Benefits
Measuring turnover cost across all five cost centers — rather than treating it as a single recruiting-fee event — produces four compounding operational benefits.
Benefit 1: Rational Retention Investment
COOs who build a full five-center turnover cost model commonly find that the exercise produces a number two to four times higher than their intuitive prior estimate. That recalibration changes their willingness to invest in retention programs, onboarding infrastructure, and documentation discipline — because the cost of underinvestment becomes visible and calculable.
Benefit 2: Shorter Productivity Ramp Windows
Firms that implement structured 30-60-90 day onboarding frameworks with milestone-based competency checkpoints tend to observe shorter ramp windows in practice. Because the productivity ramp is frequently the largest single cost center, reducing ramp duration has a directly calculable ROI against the turnover cost model.
Benefit 3: Reduced Knowledge Concentration Risk
Building and maintaining role-specific standard operating procedures, exception logs, and configuration records as living documents — rather than allowing institutional knowledge to reside in individual employees’ working memory — is the single most effective structural hedge against the knowledge-transfer component of turnover cost. It also reduces the quality defect rate during ramp windows for future replacements.
Benefit 4: Negotiating Leverage for Retention-Linked SLAs
A COO who knows their true baseline turnover cost can negotiate retention-linked pricing structures with their offshore staffing provider — contractually capping attrition at a defined threshold, with provider-absorbed replacement costs above that threshold. A provider cannot absorb a risk the client has not quantified. Measurement is the prerequisite for negotiation.
Benefit 5: Predictable Seasonal Planning
Understanding the Q1 and Q4 attrition seasonality in the Philippine labor market allows firms to pre-position candidate pipelines before high-risk windows rather than reacting to departures. Pre-positioning reduces time-to-replacement and directly compresses the productivity-ramp cost component on a per-event basis.
Costs & Pricing
What a Single Turnover Event Actually Costs
When all five cost centers are aggregated, the total cost of a single turnover event in a mid-level offshore accounting role — a senior bookkeeper or payroll specialist earning in the PHP 35,000–55,000 per month range — can be estimated at three to six months of fully-loaded compensation. This is an illustrative estimate. The direct out-of-pocket recruiting cost may appear to be only a fraction of that figure.
General human resources management guidance suggests that total replacement costs can range from one-half to two times an employee’s annual salary depending on role complexity and seniority. For offshore roles, the arithmetic shifts: base salary is lower (often materially below US-equivalent for comparable roles), but the proportional cost of ramp and knowledge transfer can be higher because firm-specific training is not portable.
The Offshore Statutory Reset
Philippine statutory employment costs add approximately 12–15% above base salary in mandatory contributions: SSS (Social Security System), PhilHealth, Pag-IBIG, and 13th month pay under Presidential Decree No. 851. Every turnover event resets this statutory investment in addition to direct replacement costs.
A firm that treats offshore staffing as a pure arbitrage play — capturing the salary differential without investing in retention — will find that repeated turnover events erode a meaningful portion of the cost advantage they are trying to capture.
The Practical Turnover Cost Model
A functional turnover cost model does not require sophisticated software. It requires five columns and honest estimates:
| Role Tier | Monthly Fully-Loaded Comp | Ramp Duration (weeks) | Ramp Output % | Manager Hours Diverted | Estimated Per-Event Cost |
| Junior bookkeeper | [Insert] | 8–10 weeks | ~35% output (illustrative) | ~15% of manager week | ~3 months comp (illustrative) |
| Senior bookkeeper / payroll specialist | [Insert] | 10–13 weeks | ~30% output (illustrative) | ~20% of manager week | ~4–5 months comp (illustrative) |
| Client-facing accounting associate | [Insert] | 12–16 weeks | ~25% output (illustrative) | ~25% of manager week | ~5–6 months comp (illustrative) |
All ranges are illustrative estimates. Actual costs vary by role complexity, documentation maturity, and management quality.
The client-facing multiplier is higher because relationship continuity has a direct revenue-retention dimension. When a client-facing offshore associate departs, the client notices — and that noticeability carries a revenue risk that is operationally real even when it is difficult to quantify precisely.
Retention-Linked Pricing: Transferring the Risk
Retention-linked pricing structures — where offshore staffing providers absorb replacement costs above a contractually defined attrition threshold — are an emerging mechanism for transferring turnover risk from the client firm to the provider.
A composite mid-market firm that negotiated a retention-linked SLA with its offshore staffing provider—contractually capping attrition at 15% annually, with provider-absorbed replacement costs above that threshold—reported that calculating its true baseline turnover cost was the highest-value operational insight it extracted from the engagement.
To negotiate these structures effectively, a COO must first know their true baseline turnover cost.
Data Privacy Compliance Cost
Under the Philippine Data Privacy Act of 2012 (Republic Act 10173), offshore staffing arrangements require Data Processing Agreements and NPC-mandated PIP-PIC agreements. Turnover events create compliance re-execution obligations — access credential revocation, new-hire coverage confirmation, and data governance review — that represent a recurring operational cost for firms experiencing two to four turnover events per quarter. This compliance administration burden belongs in the turnover cost model.
See compliance and service structures guide for a structured overview of data privacy obligations in offshore accounting engagements.
Global Case Studies
Anonymized composite case studies based on operational engagements; specific firm details are not disclosed.
Case Study 1: The 4.2-Month Discovery — US Accounting Practice
A US-based accounting practice in the $8–15M revenue band with six offshore bookkeeping staff experienced two turnover events in a single quarter. When the COO mapped all five cost centers — recruiting, onboarding labor, productivity ramp, quality defect rework, and manager time diversion — the aggregate cost per event was estimated at 4.2 months of the departed employee’s fully loaded compensation. That was approximately three times the COO’s prior intuitive estimate.
The COO’s prior estimate had been based entirely on the recruiting fee and two weeks of onboarding time. Three cost centers had never been counted:
- The productivity ramp deficit — six to eight weeks of sub-50% output
- The manager time diversion — approximately 20% of the operations manager’s hours for six weeks
- The quality defect rework — four to six hours of senior staff time per week during the ramp window
Three uncounted cost centers. Three times the actual cost.
Case Study 2: The Knowledge Concentration Disruption — Professional Services Composite
Three professional services firms in the $5M–$20M revenue band, examined as a composite, shared the same failure pattern: a single offshore payroll specialist was the only person who knew a set of client-specific configuration exceptions, and none of it was written down. When that specialist left, the firm lost three weeks of normal service continuity while the replacement rebuilt that knowledge from scratch. The recruiting fee to replace the specialist was the smallest number in the whole event — the client escalations that followed cost far more.
The structural mitigation implemented post-event: mandatory exception logs and configuration records maintained as living documents, reviewed quarterly, and included in every new-hire onboarding package.
Case Study 3: Seasonal Attrition Pre-Positioning — US Tax and Advisory Firm
One US tax and advisory firm, anonymized for this case study, ran 12 offshore staff and treated the Q1/Q4 attrition pattern as a planning input rather than a surprise. They built a standing 60-day pipeline of pre-screened candidates ahead of each high-risk window. The payoff showed up directly in their replacement timeline: time-to-replacement dropped from nine weeks to roughly 3.5 weeks, which in turn compressed the productivity-ramp cost by an estimated 40–45% per event.
The intervention required no capital expenditure. It required only operational planning discipline applied to a predictable seasonal pattern.
Case Study 4: The Ramp Window Measurement — Mid-Market CPA Firm
One mid-market CPA firm we worked with had never formally tracked how long it took offshore hires to reach full productivity — nobody had ever measured it. Once they put a 30-60-90 day milestone framework in place, the number surprised them: an 11-week average ramp, with the first six weeks generating six to eight hours of senior staff rework per new hire just to catch and fix errors. None of that rework time had ever shown up in a budget anywhere.
The measurement exercise itself — before any retention intervention — changed the firm’s onboarding investment decision. Visibility preceded action.
Philippines Relevance & Local Examples
The Philippine Labor Market Context
The Philippine labor market provides a large, English-proficient, college-educated workforce that supports structurally lower base-salary costs for offshore professional roles. That cost differential is real and durable. But it does not eliminate turnover cost — it changes its composition.
For offshore roles in the Philippines, the arithmetic of turnover cost shifts in two important ways:
- Base salary is lower in absolute terms, which means the absolute dollar cost of each cost center is lower than a domestic equivalent
- Firm-specific training is not portable, which means the proportional cost of ramp and knowledge transfer is higher as a percentage of base salary
Philippine Statutory Employment Costs
Philippine statutory employment costs add approximately 12–15% above base salary in mandatory contributions:
- SSS (Social Security System)
- PhilHealth (national health insurance)
- Pag-IBIG (housing fund)
- 13th month pay under Presidential Decree No. 851
Every turnover event resets this statutory investment. A firm experiencing four turnover events per year in a role earning PHP 45,000 per month is resetting statutory contributions — in addition to all five operational cost centers — four times annually.
Voluntary Attrition in the Philippine BPO and Offshore Professional Services Sector
Voluntary attrition in Philippine BPO and offshore professional services has historically ranged from the mid-teens to over 30% annually, depending on firm size, role type, and management quality. This is an illustrative general observation. The range is wide because management quality and compensation competitiveness are the primary drivers — not structural labor market conditions alone.
Seasonal Attrition Pattern
Q1 — the post-bonus season, typically January through March — and Q4 — the pre-holiday period — are historically higher-attrition windows in the Philippine labor market. Employees who have received their 13th month pay and any performance bonuses are structurally more mobile in these periods. COOs who do not plan for this cycle face predictable but unmeasured disruption.
Philippine Data Privacy Act Compliance
Under the Philippine Data Privacy Act of 2012 (Republic Act 10173), offshore staffing arrangements require Data Processing Agreements and NPC-mandated PIP-PIC agreements between the Philippine-based processor and the foreign personal information controller.
Turnover events create compliance re-execution obligations. When a data-handling employee is replaced, the firm must confirm:
- Access credentials and system permissions are revoked promptly
- The new hire is covered under existing or updated Data Processing Agreements
- Any client data the departing employee accessed is accounted for under the firm’s data governance framework
For a firm experiencing two to four turnover events per quarter — realistic given historical attrition ranges — the compliance administration burden becomes a recurring operational cost that belongs in the turnover cost model.
Comparison Table
| Cost Center | Domestic Mid-Level Role | Offshore Mid-Level Role (Philippines) | Key Difference |
| Direct recruiting cost | Higher absolute dollar | Lower absolute dollar | Offshore advantage |
| Onboarding labor | Moderate | Higher proportionally | Firm-specific training not portable |
| Productivity ramp (60–90 days) | 25–50% output deficit (illustrative) | 25–50% output deficit (illustrative) | Similar ramp curve; lower absolute cost |
| Quality defect rework | Moderate | Moderate to higher | Depends on documentation quality |
| Manager time diversion | 15–25% of hours (illustrative) | 15–25% of hours (illustrative) | Similar; compounds if manager is US-based |
| Statutory reset cost | FICA, benefits reset | 12–15% above base (SSS, PhilHealth, Pag-IBIG, 13th month) | Both reset; offshore statutory is lower absolute terms |
| Compliance re-execution | Standard HR offboarding | DPA + NPC-mandated PIP-PIC re-execution | Offshore adds data privacy compliance layer |
| Aggregate per-event estimate | 0.5x–2.0x annual salary | 3–6 months fully-loaded compensation (illustrative) | Offshore lower in absolute terms; higher as % of base |
All ranges are illustrative estimates. Actual costs vary by role complexity, documentation maturity, and management quality.
Conclusion & Actionable Takeaway
The measurement gap is the problem. COOs who cannot see the full cost of turnover cannot make rational investment decisions about retention. They systematically underinvest in onboarding infrastructure, documentation discipline, and compensation competitiveness — because the cost of underinvestment is distributed across five cost centers that never aggregate on a single report line.
The immediate action is not a retention program. It is a measurement exercise. Build the five-column turnover cost model for your two or three highest-risk offshore roles. Assign conservative estimates to each cost center. The resulting number will almost certainly be higher than your current assumption — and that recalibration is the operational insight that changes the downstream investment decision.
For firms operating offshore staffing arrangements in the Philippines, the structural priorities are:
- Implement time-to-full-productivity tracking as a standard operational metric, not an HR metric
- Build and maintain role-specific SOPs to reduce knowledge concentration risk before a departure occurs
- Plan for Q1 and Q4 attrition seasonality with pre-screened candidate pipelines
- Ensure NPC-mandated PIP-PIC agreements and Data Processing Agreements are structured to accommodate personnel changes without full re-execution delays
- Evaluate retention-linked SLA structures with your offshore provider — but only after you know your true baseline cost
The firms that treat turnover as a measured operational variable — rather than an unpredictable HR event — consistently extract more durable value from offshore staffing models than those that do not.
FAQs
How do I calculate the productivity ramp cost for a specific offshore role without a formal time-tracking system?
Use output volume as a proxy: compare the new hire’s weekly processed transaction count, file completion rate, or billable task output against the departed employee’s trailing 90-day average. The gap between those two figures, multiplied by the role’s hourly fully-loaded cost, gives you a defensible ramp cost estimate without requiring time-tracking software. Even a rough estimate — documented and consistent — is operationally more useful than no measurement.
Does the NPC-mandated PIP-PIC agreement need to be re-executed every time an offshore employee handling client data is replaced?
The agreement governs the relationship between the personal information controller (your firm) and the personal information processor (your offshore staffing provider or the offshore entity). Personnel changes within the processor do not automatically require full re-execution of the agreement — but they do require that your data governance framework confirms the new employee is covered under the existing agreement’s scope, has completed required data privacy training, and that access provisioning and revocation protocols have been followed. Review your agreement’s personnel change provisions explicitly; some require written notification to the controller within a defined window.
At what offshore team size does turnover cost become a material operational risk rather than a manageable nuisance?
The inflection point is typically around four to six offshore staff in process-intensive roles. Below that threshold, a single turnover event is disruptive but absorbable. Above it — particularly if two events occur in the same quarter — the aggregate productivity deficit, manager time diversion, and quality defect rework can materially affect client delivery capacity. Firms with eight or more offshore accounting staff who are not actively tracking time-to-full-productivity are carrying an unmeasured operational risk that compounds with each unplanned departure.
How should a retention-linked SLA attrition threshold be set, and what is a realistic starting point for offshore accounting roles in the Philippines?
A contractual attrition cap of 15% annually is a reasonable illustrative starting point for offshore professional services roles in the Philippines, reflecting the structural reality that some voluntary turnover is unavoidable in a competitive labor market. Below 15% is achievable with active retention investment — competitive compensation, structured career pathing, and management quality. Above 20–25% annually signals a systemic retention problem that a contractual SLA alone will not solve. The SLA should specify what “replacement” means (time-to-replacement SLA, candidate quality standards, and who bears the recruiting and onboarding cost above the threshold) — not just the attrition percentage trigger.
Related Services & Next Steps
Build Your Turnover Cost Model First
Before evaluating any retention program or offshore staffing structure, complete the measurement exercise: assign dollar estimates to each of the five cost centers for your two or three highest-risk roles. The model requires only a spreadsheet and honest operational estimates — no specialized software. The output will almost certainly be two to four times your current intuitive assumption, and that recalibration is the prerequisite for every downstream decision.
Structured Onboarding Frameworks
Firms that implement 30-60-90 day milestone-based onboarding frameworks with competency checkpoints tend to observe shorter productivity ramp windows in practice. Because the ramp is typically the largest single cost center, reducing ramp duration has a directly calculable ROI.
Retention-Linked Engagement Structures
Retention-linked pricing structures — where the offshore staffing provider absorbs replacement costs above a contractually defined attrition threshold — transfer turnover risk from the client firm to the provider. These structures are only negotiable once the client knows their true baseline cost.
Data Privacy Compliance Framework
Every turnover event in an offshore arrangement governed by the Philippine Data Privacy Act of 2012 creates compliance re-execution obligations. Structuring your Data Processing Agreements and NPC-mandated PIP-PIC agreements to accommodate personnel changes without full re-execution delays is a one-time legal investment that reduces the compliance cost of every future turnover event. See compliance and service structures guide for a structured overview.
OffshorePH Staffing Models
For an overview of how OffshorePH structures offshore accounting and finance engagements — including retention-linked SLA options, onboarding support, and data privacy compliance frameworks — see OffshorePH.
